If you can’t measure it, you can’t improve it.
Peter Drucker, Management Consultant
The most successful EMS operations are those which combine the mass delivery and rigidity of automation with the intelligence and flexibility of those programming the machines.
Stewart Gadd, Technical Director, Chemigraphic
Not all perfect storms are a bad thing.
In electronic manufacturing today there is a cluster of trends coalescing to offer us unprecedented levels of information and intelligence about fluctuations in every aspect of our increasingly complex business.
This perfect storm is delivering instant insight into:
- Our supply chain
- The traceability of components through – and beyond – our production operations
- The efficiencies of our manufacturing process
- Ways to reduce error, ensure consistency and increase yield
It is being whipped up by a number of related trends:
- The Internet of Things’ (IoT) offers us increasingly integrated data across all of our tech
- Cloud computing delivers the capacity to store and analyse large amounts of this data
- Automation delivers time-savings and efficiencies in both completing and reporting on tasks
- Barcoding and scanning technology allows us to accurately monitor and trace components and activities at a granular level
At the very eye of this storm, however, lies the ability to act on all this available data and intelligence as quickly as it is being produced.
Without this ability to quickly reach informed decisions, electronic manufacturers will not be riding the waves to optimal efficiency but instead, drowning under a deluge of data.
And it is the use of data-driven dashboards that is the differentiator between sinking and swimming.
From information to intelligence
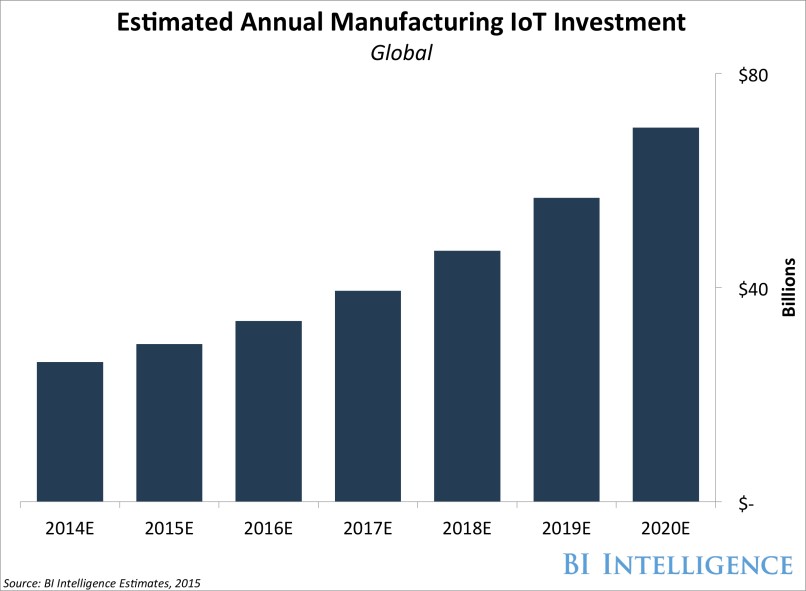
John Greenough, senior research analyst at Business Insider (BI) Intelligence, estimates that the number of IoT devices used by manufacturers will have exceeded one billion by 2020, with annual investments scaling up to $70 billion.

Manufacturers, more than any other sector, are leading the adoption of IoT. There are sound commercial reasons for this: according to a TATA Consultancy Survey, manufacturers have seen a higher return on investment from the IoT than any other industry.
Chemigraphic have long used IoT solutions to track assets in our factories, consolidate our control rooms, monitor performance, reduce errors, optimise efficiencies and increase our analytics functionality through predictive maintenance.
But as more data becomes available across our entire manufacturing operation, the key to realising further efficiencies and quality improvements lies in how – and how quickly – we act upon all this business intelligence.
It is critical that this advanced intelligence is being viewed and acted upon in real-time: we must have an at-a-glance way to assess the sheer complexity of production and supply chain factors that affect our yields and reliability.
To do this we need to have access to data that has been configured to address customers’ specific requirements. And we need to intuitively grasp high-level information about what is happening on the shop floor – and to be able to easily drilldown into each stage of the manufacturing process if required.
- We need the granularity to trace a batch of components, monitor a machine or review a technician’s progress
- We need the overview to schedule tasks and switch job runs
- And we need automatically generated (machine) intelligence reports that are distributed appropriately to highlight any variances or optimisation potentials that arise

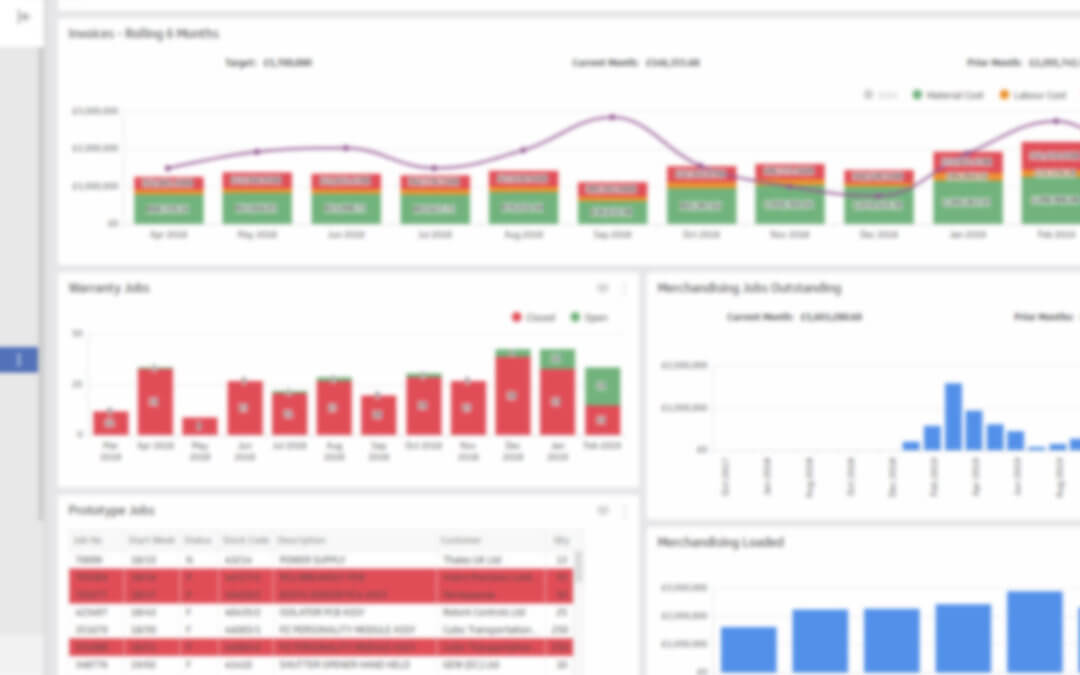
Real-time data-driven dashboards at Chemigraphic
At Chemigraphic, we know the difference such real-time data-driven dashboards make.
Dashboards are displayed across our company, in every department from factory operations to sales, purchasing and procurement.
- They are colour-coded, user-friendly and instantly readable, making it easy to identify and react to issues as they arise in real-time
- They are an enhancement of our automated processes, helping link together our data collection, barcoding and traceability. All job numbers are barcoded – and all employees have barcodes – so jobs can be monitored and data can be isolated or collated as needed
- They are an essential part of our commitment to customer service, realising time and cost efficiencies, driving performance, ensuring quality, maintaining responsibility and offering traceability
- They allow us to:
- Provide training and support to be given to staff who are encountering delays on a job
- Ensure a smooth workflow by lining up jobs for those who are nearing a project’s completion
- Spot trends and variances whether positive or negative, to ensure future improvements
- Retrospectively check customer or project data against exact timestamps to identify issues or performance markers
The scores on the doors for dashboards
A recent Aberdeen Group study into Manufacturing Operations Benchmarks confirms what we discover every day as we use real-time analysis to prevent problems, guarantee reliability and drive cost-efficient optimisations.
Here’s what it discovered from a survey of 223 organisations at the cutting edge of manufacturing services:
- About a third of these handled plant data via real-time/event-driven dashboards with role-based data accessibility, navigation, aggregation and drill down
- Real-time operational dashboard users were twice as likely to have visibility of critical real-time areas such as quality, compliance, global operations and processes

- Because of this visibility, 71 percent of dashboard users have the ability to collect, plan and schedule, aggregate, analyse and respond to real-time manufacturing events − nearly three times the rate of non-users
- They also have improved their time-to-decision at a rate 5 times greater than non-users
Dashboards lie at the centre of a perfect storm
Commenting on the role of automation, data collection and real-time analysis in driving our business, Stewart Gadd, our Technical Director, affirmed that:
‘Chemigraphic relies on the strength and insight provided by the data network that runs throughout the company.
Collecting, analysing and acting on data, whether it relates to customer purchases, productivity levels of staff or the efficiency of internal systems, is vital in measuring and improving our overall performance.
By tracking spikes, dips and other trends in the data we collect across the business, we can start to make observations on what is working well, what needs to change and successes we need to celebrate and champion.’
We intend to stay right at the centre of this perfect storm.